













Respiratory Dashboard Code and One-Pager
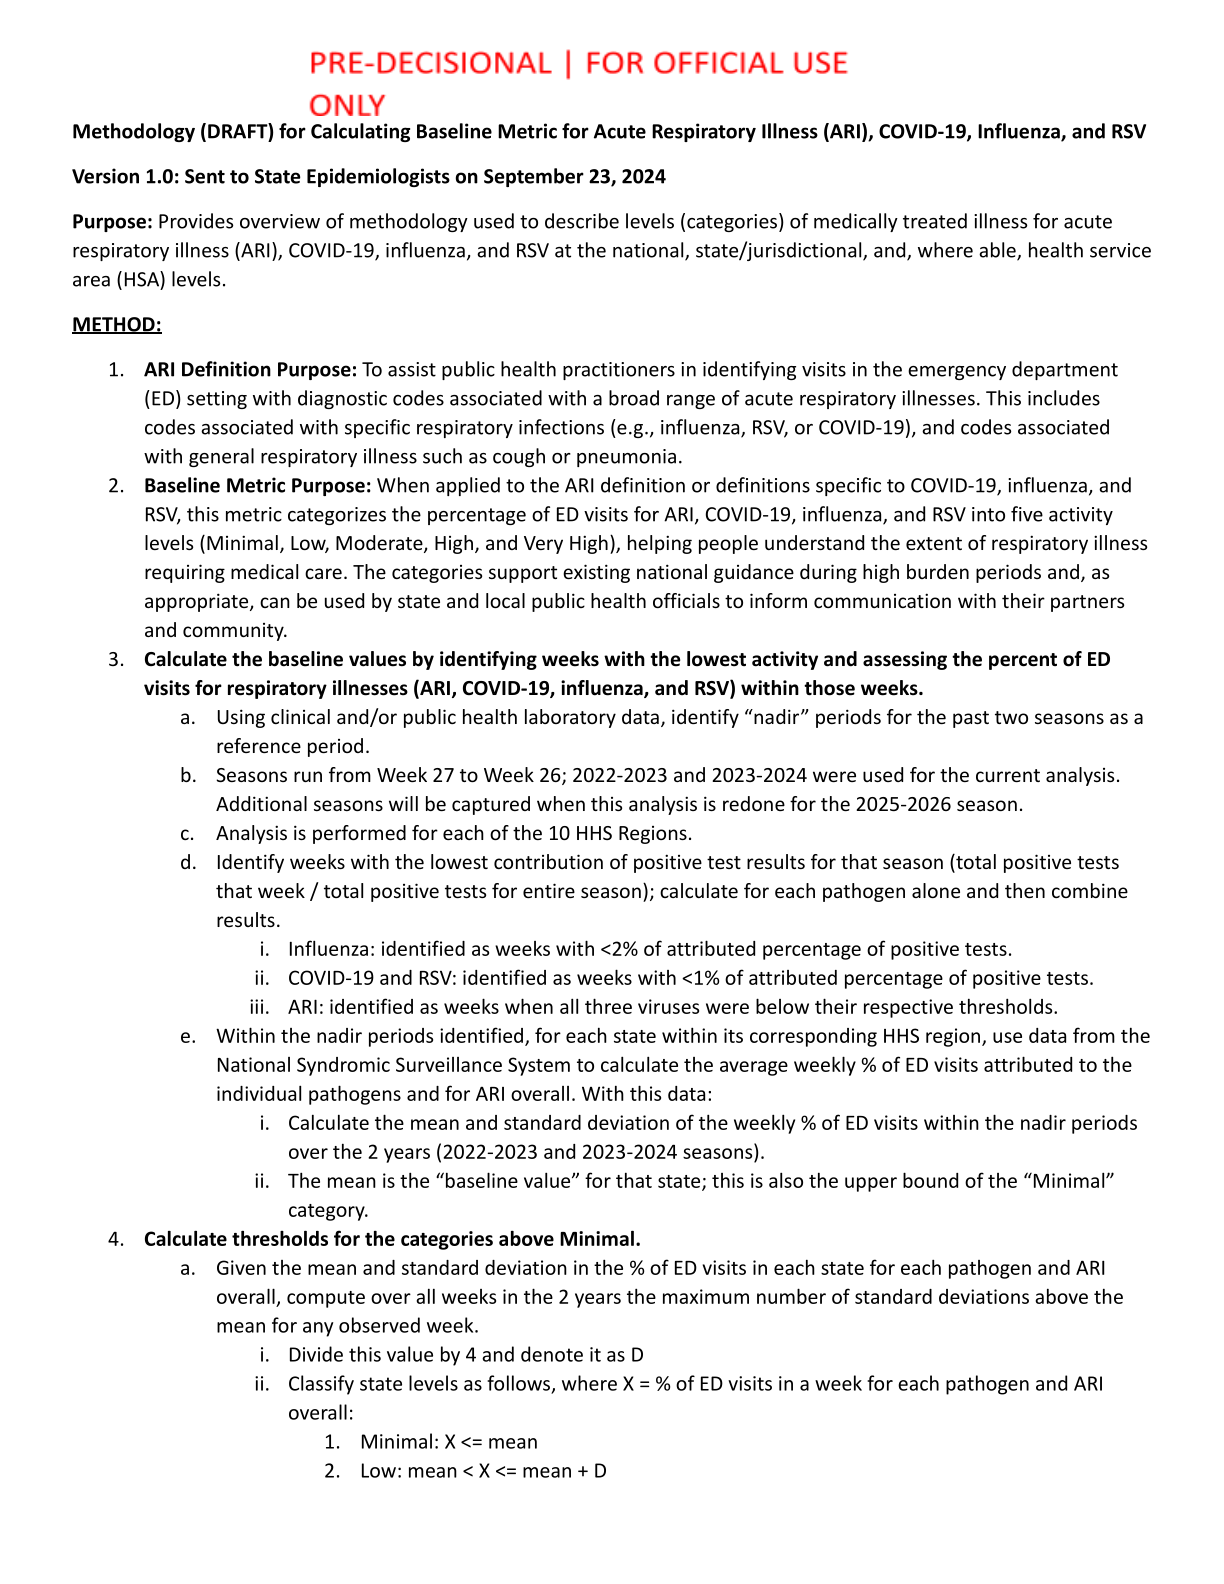
To access the code, please visit dashboards.syndromicsurveillance.org. Login with your AMC/ESSENCE credentials then select the NSSP PRESS item from the list. Once you connect, please search for the “ARI Code Package,” and when you click the name or preview, a window will come up, and you can download the zip file containing the code. Please note that the name will be something like “6b9127dd566e408dbe2980840334f695.zip” as this is the way that press resources are stored, but once downloaded, inside you will find the needed R code and supporting files. Please extract the files from the zip folder and upload them to your Posit workbench. Once in Posit, double-click on the R project file to open it. From there, follow the instructions in the R Markdown. Respiratory illness activity levels are based on comparing the percent of emergency department visits for ARI during the current week to the average percent of visits during times when flu, COVID-19, and RSV visits were low (Note: other respiratory illness-related visits may still be occurring). These low points are considered "baseline" levels of respiratory illness activity The activity level is based on how elevated the current week is from the "baseline" period. You can also review Activity Levels data notes for the detailed methodology.